RESTAURANT INTELLIGENCE

Know what matters.

Act before it’s too late.

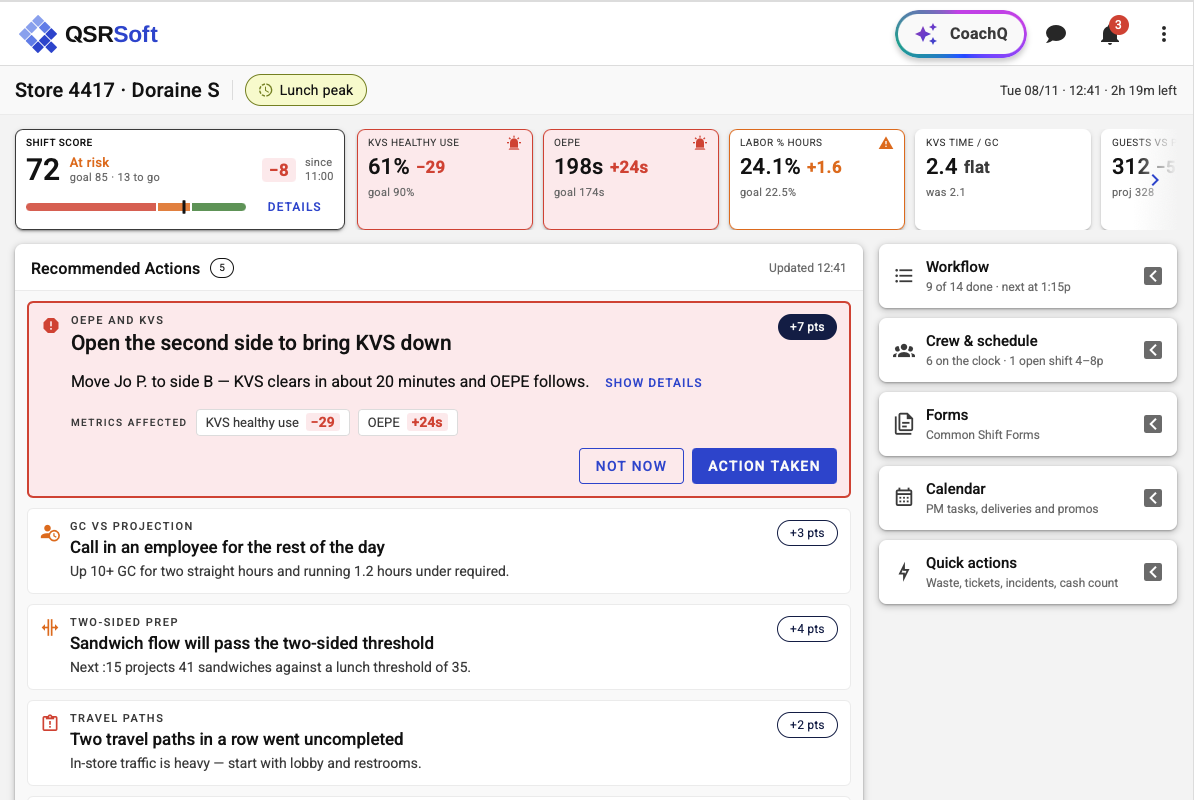
Restaurant operations have become too complex to manage through reports, spreadsheets, and human effort alone. QSRSoft connects the systems and operational data that drive your P&L: sales, labor, food cost, and cash. CoachQ turns that intelligence into clear priorities, explanations, and recommended actions.

coachq.qsrsoft.com
Live · 312 stores
Ask CoachQ
What are today's top priorities?
Where are my labor opportunities this week?
What's driving my guest count decline?
Break down my OEPE components for the past week.
Find potential fraud and theft across all stores.
CoachQ Recommendation
Sales vs LY+2.8%
Guest count−1.1%
Labor vs forecast14 stores over
Drive-thru OEPE7 stores declining
Top priority · today
3 stores are driving 71% of service-time variance. Start with Store 248. Review lunch staffing between 11am and 2pm.
01The Real Operating Problem

Every system has something to say.

Restaurant Intelligence knows what matters.

Restaurant teams are surrounded by data from sales, labor, food cost, inventory, service, cash, forecasting, and security. Each system reveals part of the operation, but operators still have to decide what matters most, who needs to act, and whether there is still time to change the outcome.

When everything demands attention,

the right decision is easy to miss.

QSRSoft/Operating Brief/Today
Live
  • SalesGuest count declining
    12 stores
  • Labor14 stores over forecast
    During lunch
  • Food CostVariance increasing
    This week
  • ServiceDrive-thru times slipping
    Across several locations
  • CashDeposit exceptions
    Require review
  • SecurityRefund anomalies
    Detected
The Operator’s Problem
What deserves attention first?

The data exists. The priority does not.

02The Missing Capability

Restaurant Intelligence turns operational complexity into clear decisions.

It connects operational data with restaurant context, history, hierarchy, patterns, and performance relationships to reveal what matters, explain why, and guide what happens next.

Restaurant Intelligence is the layer between operational data and operational action.

  • Know what matters

    See the stores, opportunities, and risks that deserve attention first.

  • Understand why

    Connect performance changes to operating context, patterns, and root causes.

  • Know what to do next

    Turn intelligence into clear priorities and better operational decisions.

QSRSoft/Intelligence Layer
Updated
Operational Data
Sales
Labor
Inventory
Food Cost
Service
Cash
Forecasting
Security
Restaurant Intelligence
Context
History
Hierarchy
Patterns
Benchmarks
Relationships

Data joined with restaurant context becomes intelligence.

Operational Action
  • What matters
  • Why it matters
  • What to do next
03Why QSRSoft

Restaurant Intelligence was built inside real restaurant operations.

Over twenty-five years.

For twenty-five years, QSRSoft has connected the systems behind multi-unit restaurant operations and learned where performance breaks down, what leaders need to see, and what actions improve outcomes.

25 Years

Inside Restaurant Operations

14,000+

Restaurant Locations

Every Major Domain

Connected Operational Context

Restaurant Intelligence

Built from Operating Experience

The category was not invented in a conference room.

It was built restaurant by restaurant.

04THE QSRSOFT INTELLIGENCE ENGINE

Every recommendation follows the same reasoning.

Detect. Understand. Recommend.

The QSRSoft Platform connects restaurant data with the operational context behind it. Every recommendation follows the same reasoning: detect what changed, understand why it matters, and recommend the next best action.

The QSRSoft Intelligence Engine creates Restaurant Intelligence.

CoachQ puts it into every operator’s hands.

The model in practice
Observation
14 stores are running over labor forecast during weekday lunch.
Understanding
The largest variance is concentrated between 11 a.m. and 2 p.m. in a small group of stores.
Recommendation
Move two crew positions from lunch to the dinner peak at the highest-opportunity locations.
Expected outcome
Recover labor efficiency without lowering service standards.
HOW RESTAURANT INTELLIGENCE REASONS
Operational reality
Sales, labor, inventory, food cost, service, cash, forecasting, and security
Detect
What changed?
Understand
Why did it happen, and what matters most?
Recommend
What should happen next?
Business outcome
A better operational decision, made in time to matter
05One intelligence layer. Every domain.

One Intelligence Layer. Every operational domain.

The QSRSoft Intelligence Engine applies the same reasoning across every major restaurant operation. Select a domain to see how Restaurant Intelligence detects what changed, understands why it matters, and recommends what to do next.

Choose an operational area
Restaurant Intelligence/Labor Intelligence
Live
Labor % of sales
27.4%
+1.8 pts vs plan
Hours over forecast
312
14 stores flagged
Dinner peak coverage
86%
Target 95%
Lunch labor variance
11:00 → 14:00
Signal above tolerance · escalated to Restaurant Intelligence
Highest-variance stores
5
  • Store 248Region 4+38 hrs+14%
  • Store 312Region 2+29 hrs+11%
  • Store 407Region 4+24 hrs+9%
  • Store 519Region 1+21 hrs+8%
  • Store 634Region 3+18 hrs+7%
CoachQ detected

Weekday lunch labor over forecast in 14 stores.

CoachQ understood

Store 248 has the largest 11am–2pm variance.

CoachQ recommended
Next best action
Move two crew positions to dinner peak.
Expected outcomeRebalanced labor, stronger dinner peak
06Meet CoachQ

If your team can ask a question…
They already know how to use CoachQ.

Ask CoachQ exactly as you'd ask another member of your team. No training. No complex dashboards. Just instant answers, operational insight, and a recommended next action.

Plain language
Ask any operational question.
Instant clarity
CoachQ analyzes your operation and explains what matters.
Action you can trust
Receive one prioritized recommendation.
Try asking CoachQ
CoachQ · Conversation
Live · Portfolio
You
Where are my labor opportunities this week?
Q
I found 14 stores running over forecast during weekday lunch. Store 248 represents the biggest opportunity.
Start Here
Store 248
Window
11am–2pm
Hours vs target
+1.7%
Business Impact
$11.2K / wk
CoachQ detected
Weekday lunch labor over forecast in 14 stores.
CoachQ understood
Store 248 concentrates the largest 11am–2pm variance.
CoachQ recommended
Next best action
Shift two crew positions from lunch to dinner peak.
Suggested follow-ups
Which stores improved most last week?Compare Store 248 to its region.Show weekend labor trends.
Ask CoachQ anything…
Send
07Restaurant Intelligence in Action

A recommendation is only valuable when the right person acts on it.

Insight without ownership is noise. QSRSoft turns every CoachQ recommendation into a routed decision — assigned, scoped, timed, and verified across the operation.

Owners, Area Coaches, and General Managers each receive the same intelligence, shaped for their role and the moment they need to act.

Median time to route
under 90s
Recommendations closed
94%
Silent recos week 1
0
Follow-through visibility
portfolio-wide
Restaurant Intelligence/Execution
Live
From CoachQ · Next best action
REC-08421
Review lunch staffing and kitchen positioning at Store #248.
Owner
J. Kim · GM
Escalates to R. Alvarez
Scope
Store #248 · Downtown
Weekday lunch · 11a–2p
Window
Act by Fri 10:30a
Verify over next 7 days
Routing lane
Role-aware delivery
MP
Owner
M. Patel
Portfolio · 42 stores
RA
Area Coach
R. Alvarez
Region West · 11 stores
JK
General Manager
J. Kim
Store #248 · Downtown
Assigned
Follow-through
Verified against POS + Labor
  1. RoutedT + 0m

    CoachQ recommendation assigned to J. Kim (GM, #248).

  2. AcknowledgedT + 6m

    GM opened the recommendation on the mobile shift board.

  3. AppliedT + 41m

    Two crew moved from lunch to dinner peak in the schedule.

  4. VerifiedT + 24h
    Now

    Labor % vs. forecast auto-reconciled against POS.

  5. ClosedT + 7d

    CoachQ confirms sustained outcome across the affected shift band.

Expected outcome
Verified by QSRSoft
$11.2K weekly labor recovered — with no impact to service scores.
Labor %
27.4 → 24.9
Speed of Service
+2s (within tol.)
Guest score
4.7 (flat)
08One Intelligence Layer

One intelligence layer.
Different decisions for every role.

Restaurant Intelligence adapts to the decision each role has to make. Executives see portfolio priorities. Operators see regional risk. Managers see the next action for their shift.

One layer of intelligence. Personalized automatically for the person acting on it.

Data becomes intelligence. Intelligence becomes better restaurants.

  • Executive

    01

    Portfolio performance summarized into one clear recommendation.

    Where should I focus this week?

  • Operations Leader

    02

    Regional priorities ranked by business impact.

    Which regions need my attention today?

  • Area Coach

    03

    Store visits prioritized automatically.

    Which store should I visit first?

  • Store Manager

    04

    Daily operational guidance before the shift begins.

    What do I need to fix before lunch?

  • Crew Member

    05

    Simple priorities for the current shift.

    What should I focus on right now?

Data
Reports
Restaurant Intelligence
Better Decisions
Better Restaurants

See Restaurant Intelligence in action.